Discover & Visualise The Data In Kibana
Discover & Visualise The Data In Kibana
Amazon ElasticSearch comes with the Kibana plugin installed to assist you in visualising and analysing your data. Because of the way the security model works, all calls into the Elastic Search cluster, including connecting to Kibana, must be signed with credentials. For us to connect to Kibana we need to either sign the request which the browser can’t do or we need to open it to our IP. Let’s do the latter and add our IP to the cluster security policy.
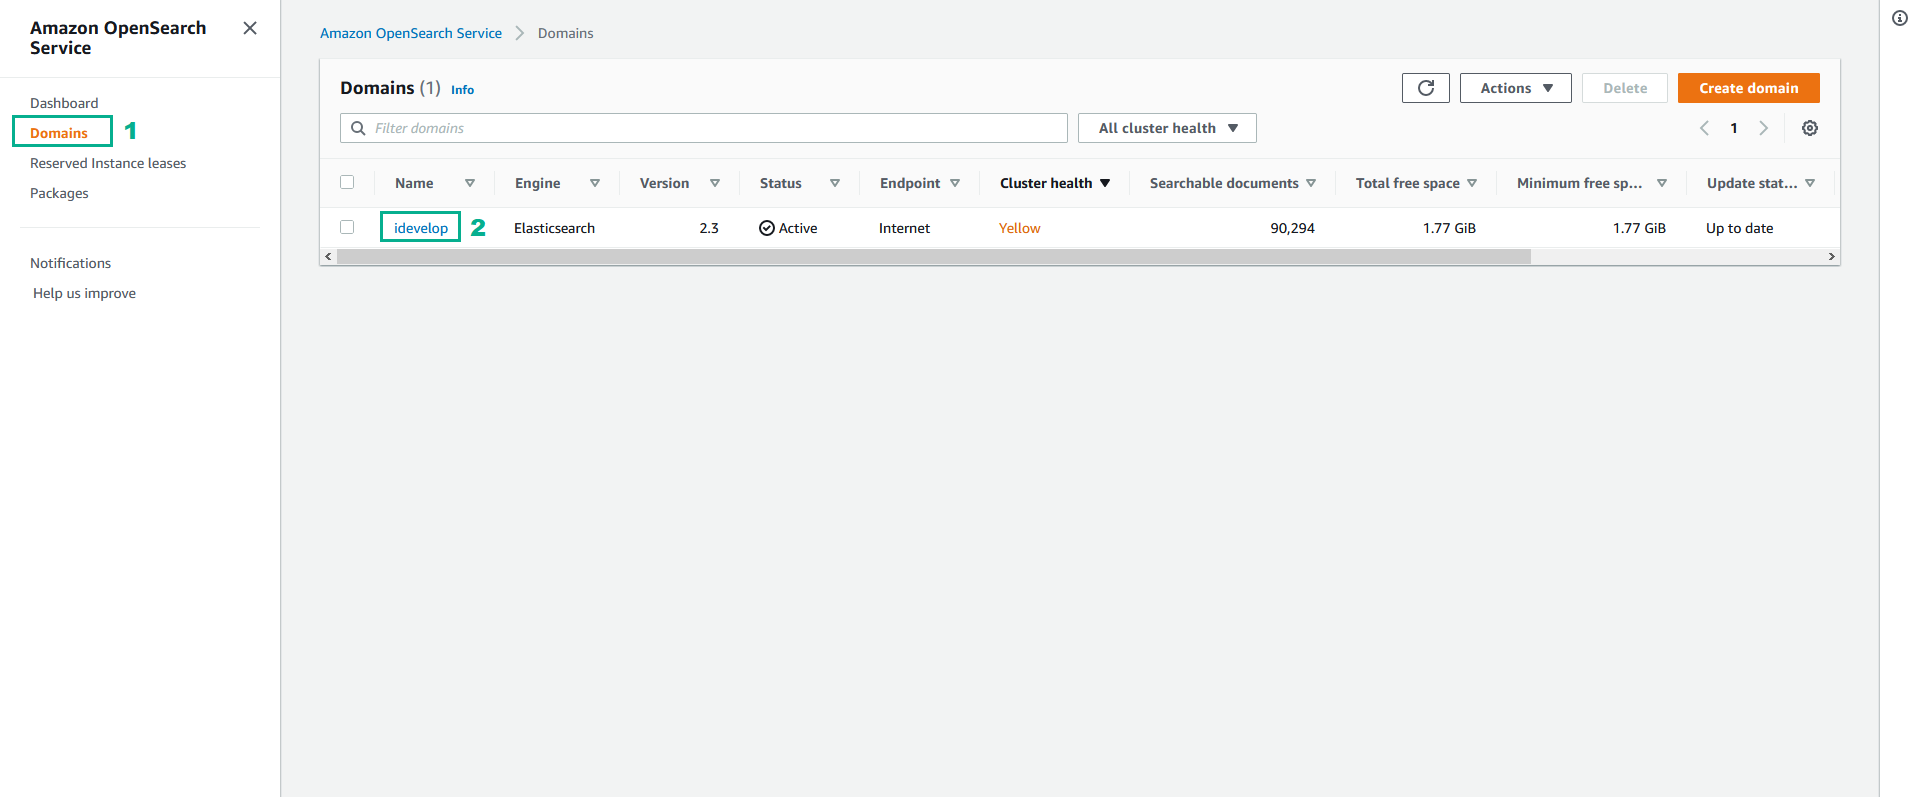
- Click Domains
- Click idevelop
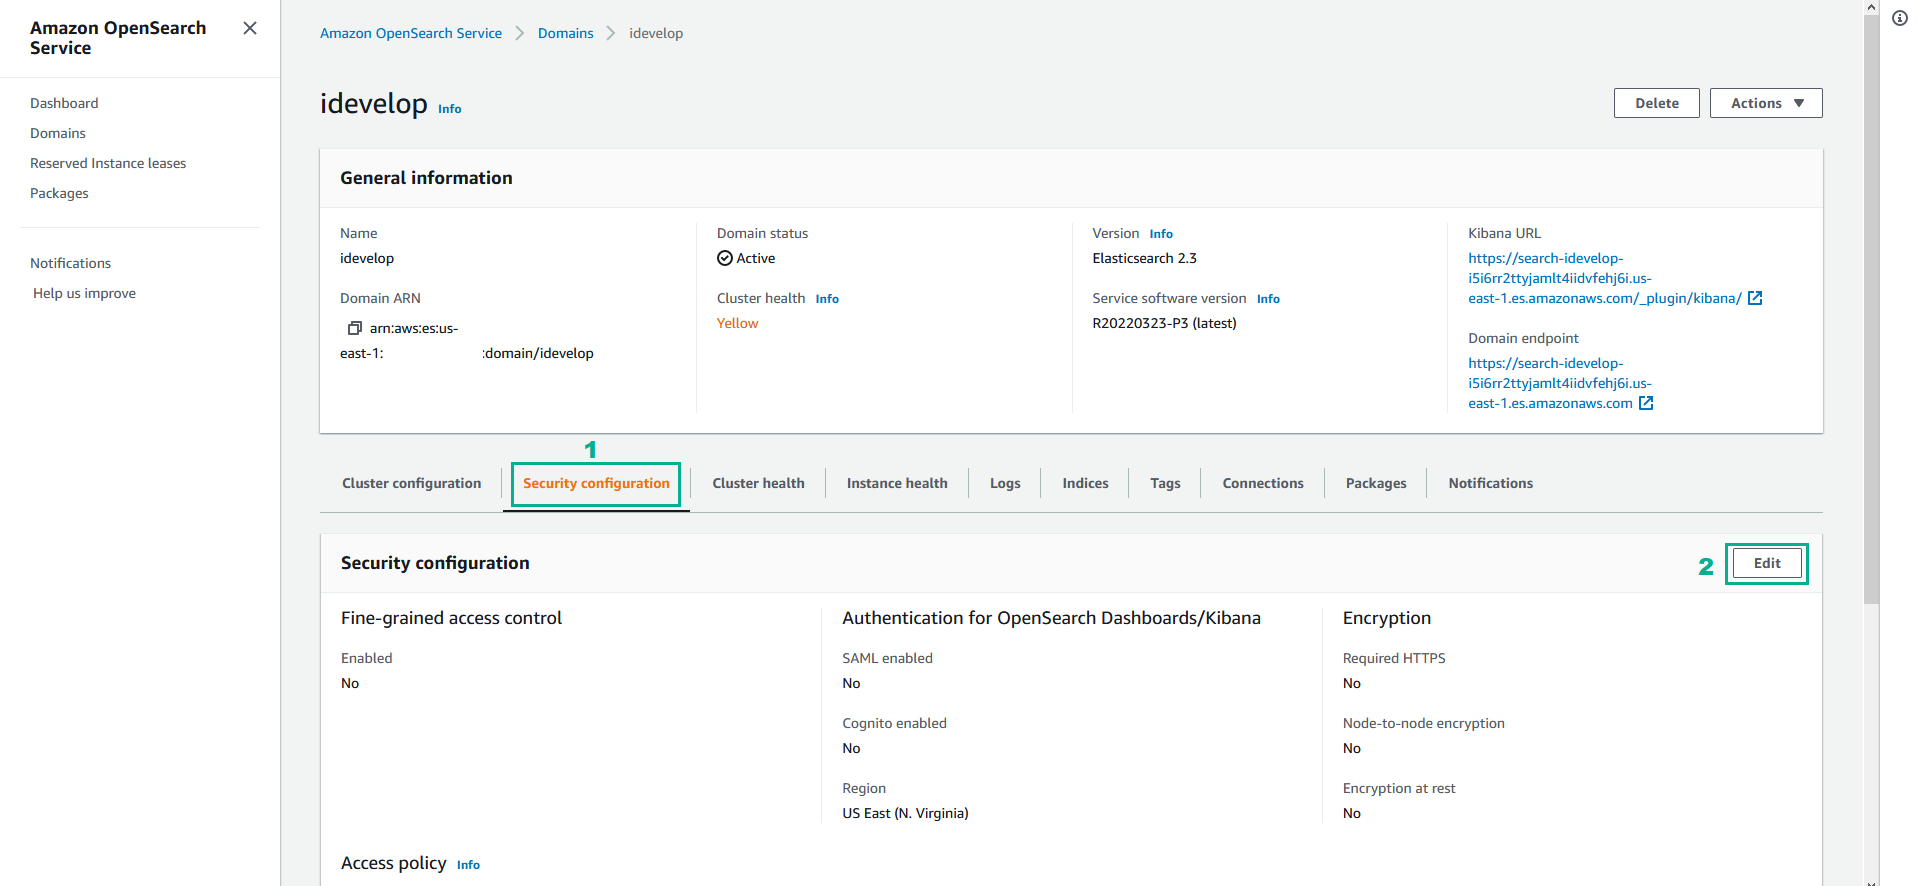
- In the idevelop page
- Click tab Security Configuaration
- Click Edit
- In the Access policy section
- Find the part with Condition and IpAddress and type your IP
You can either use https://checkip.amazonaws.com/ to identify your IP, or use some other tools like
curl ifconfig.me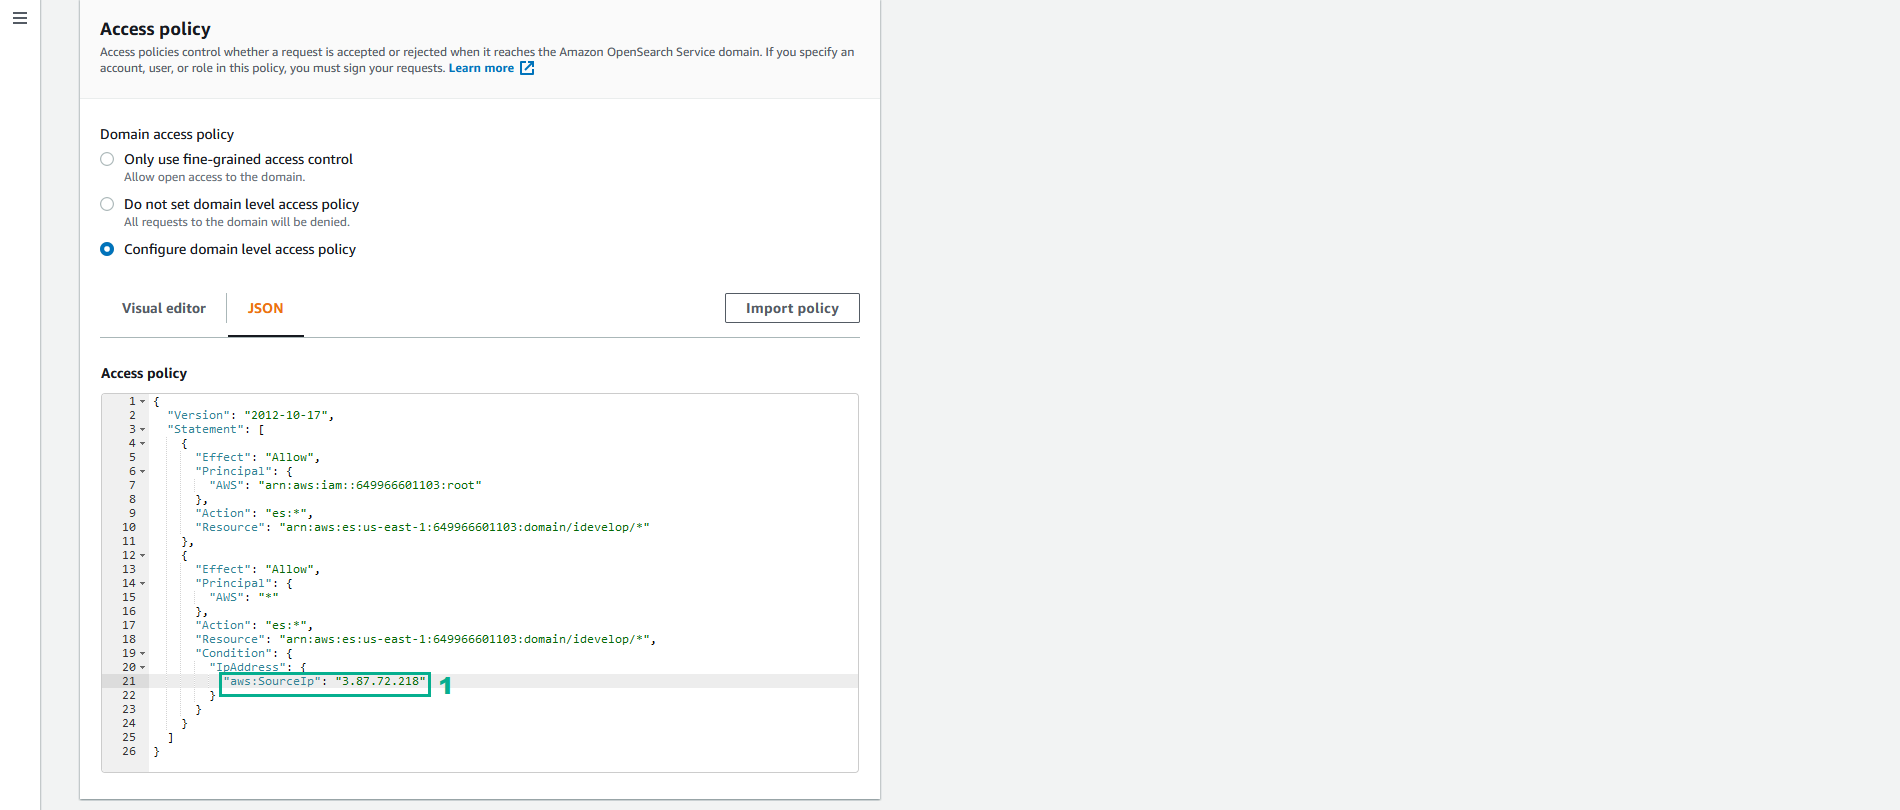
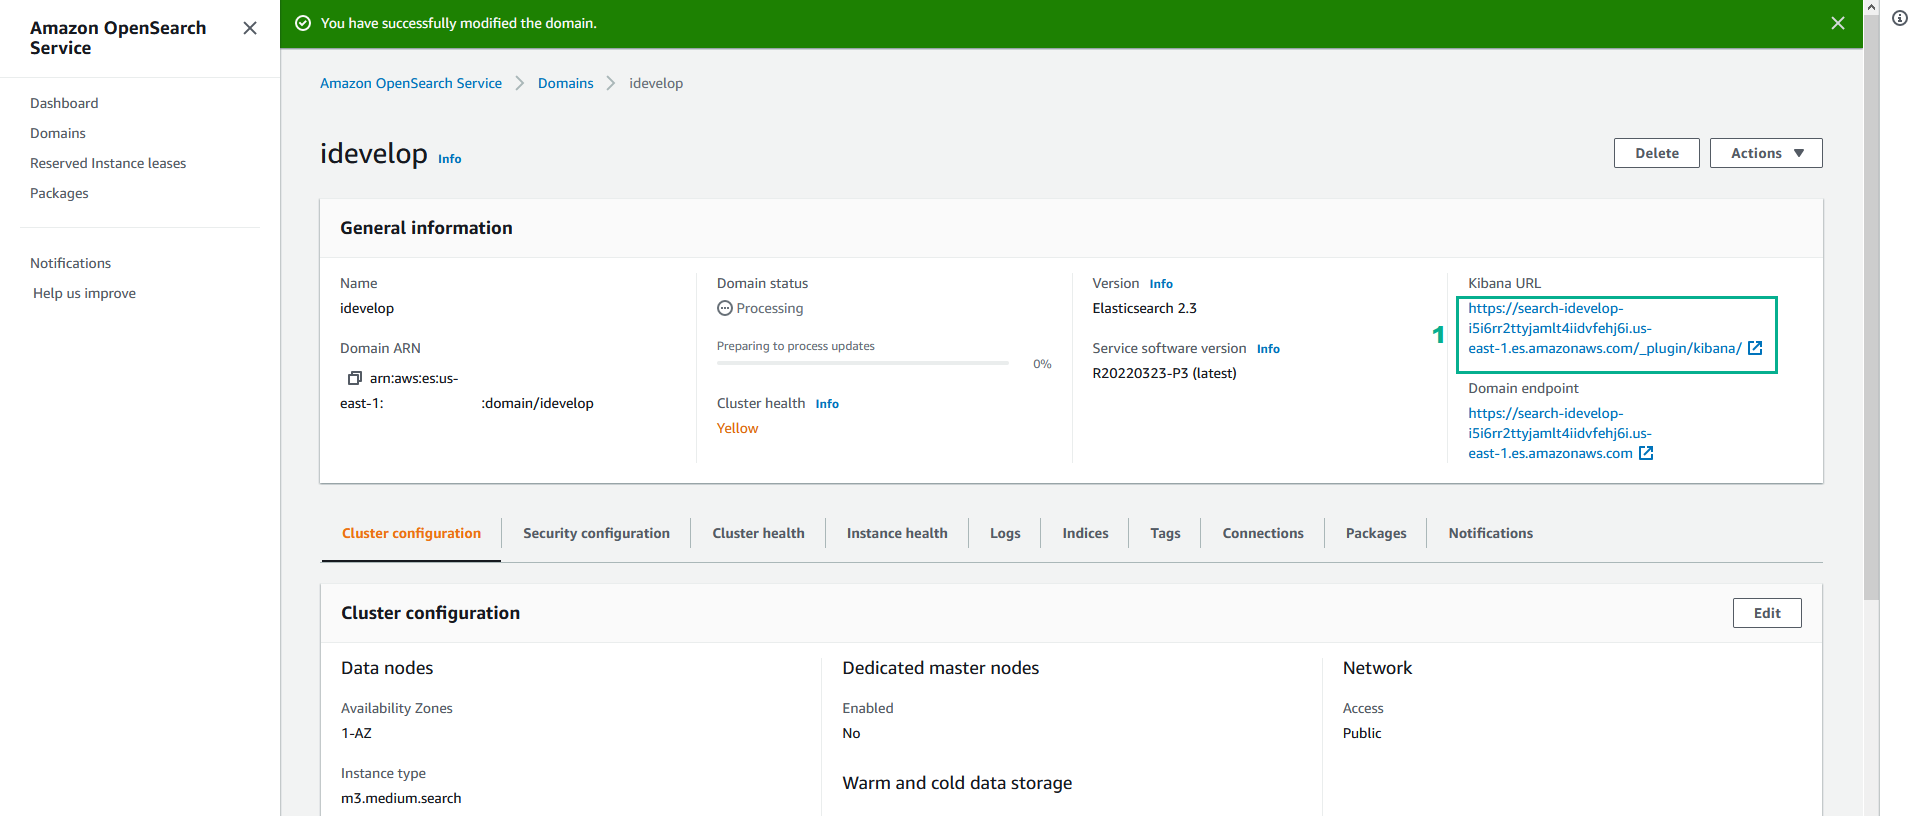
- Drag the screen down, then click Save changes
- Click link in the Kibana URL section
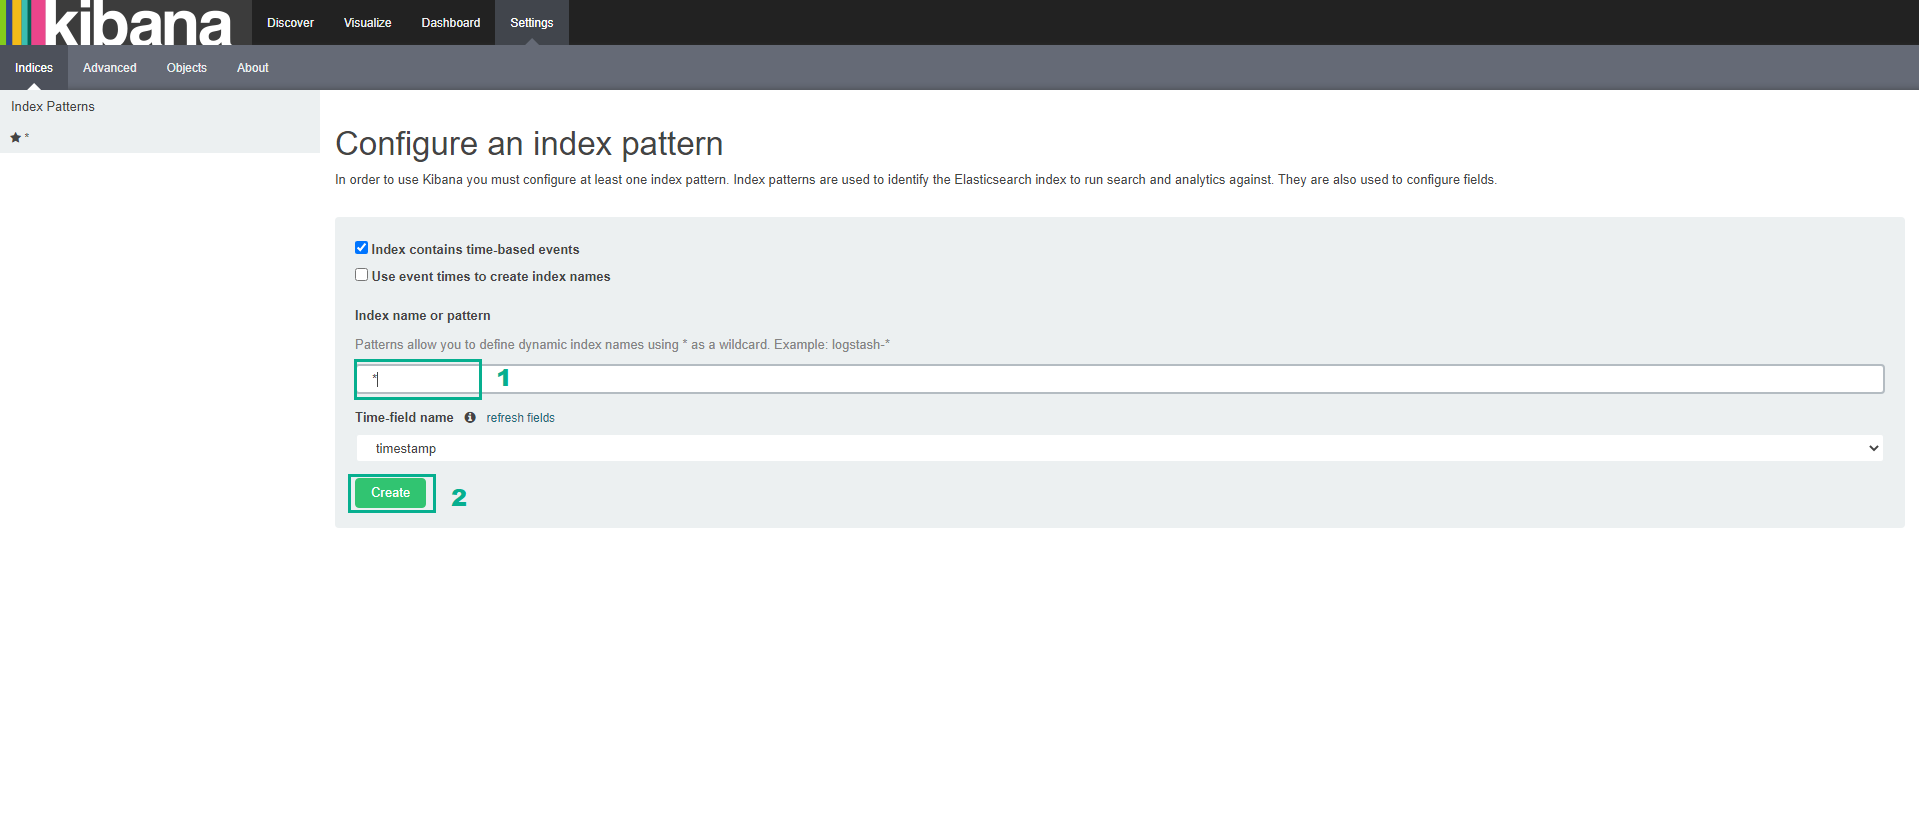
- Your first task is to set up a default index pattern. In the field beneath Index name or pattern, replace the contents with an asterisk
*
- Click Create
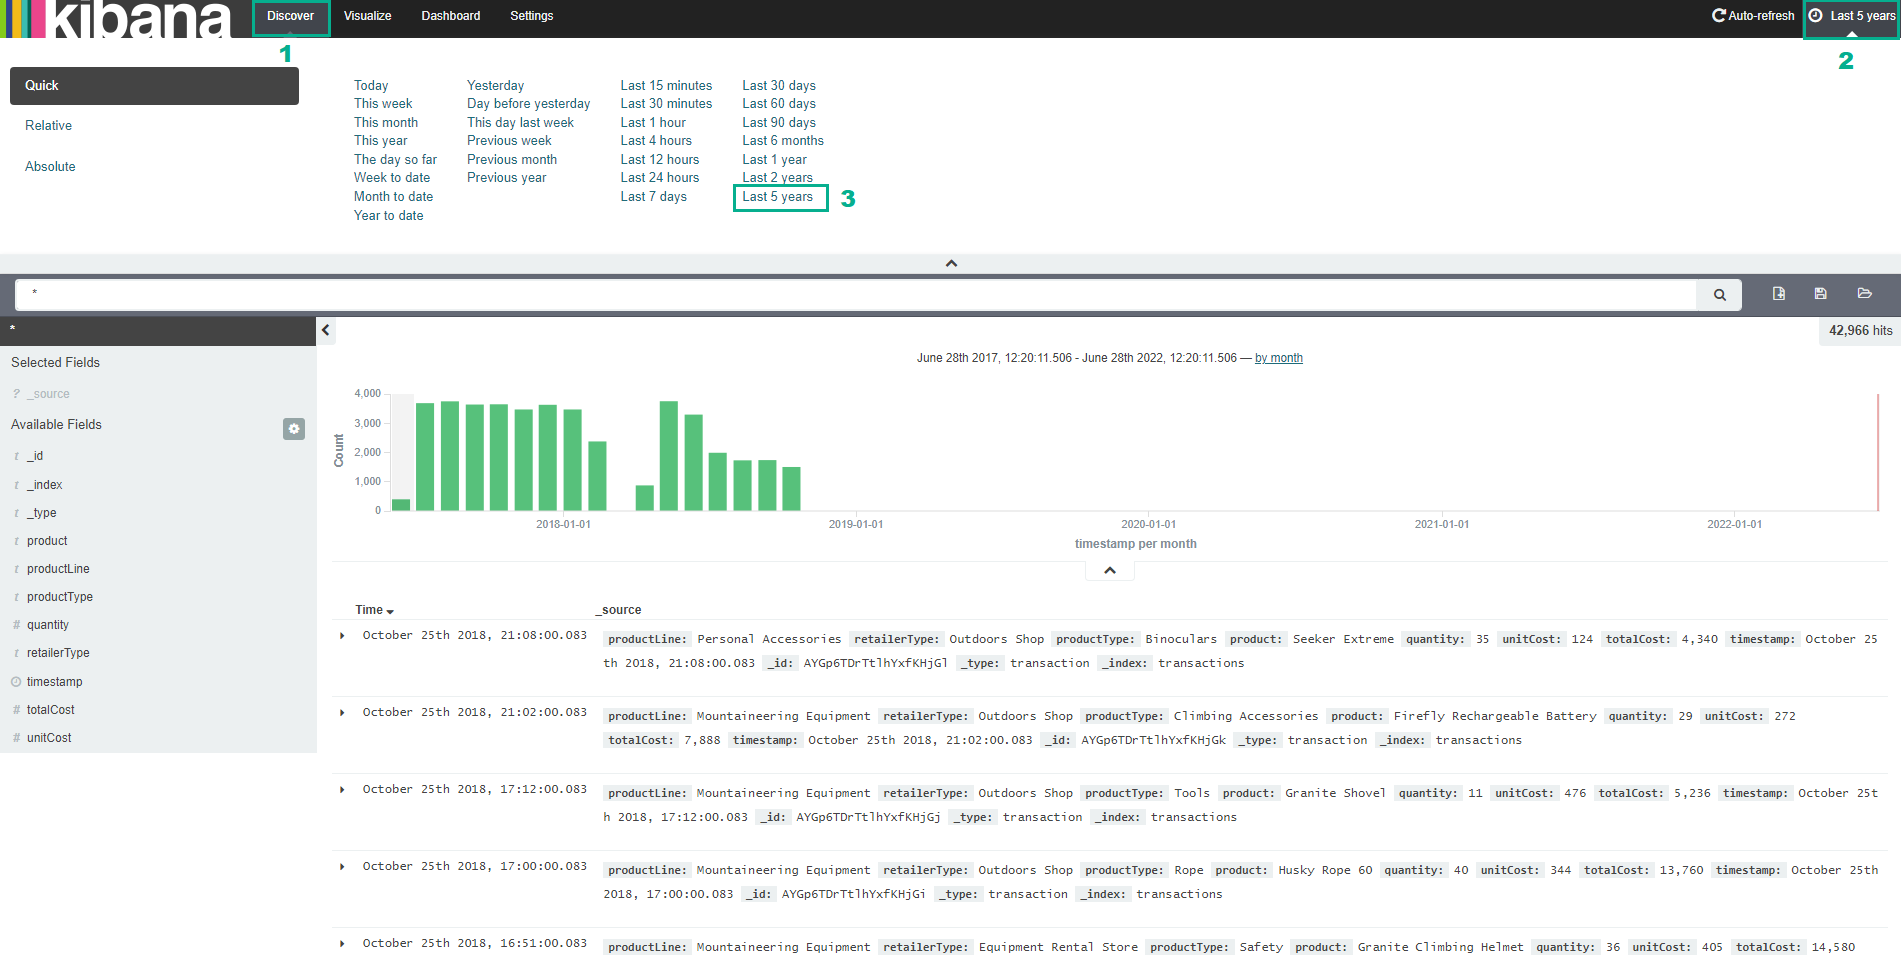
- Click Discover in the top menu tab
- You may not see any records rendered. At this point, Kibana is defaulting to only show you records that have a timestamp value in the range now minus 15 minutes ago. Our application generates sales events with timestamps starting in 2015 and advancing forward at random increments. Therefore, you may not see any records for the timeframe that spans the Last 15 minutes. Widen the timeframe by clicking on the Last 15 minutes link at the top right of the page, and in the list that appears, choose Last 5 years
- Click on one of the records in the list to expand it. The fields in the data relate to our transaction record for the fictitious sales - productLine, product, totalCost, etc.
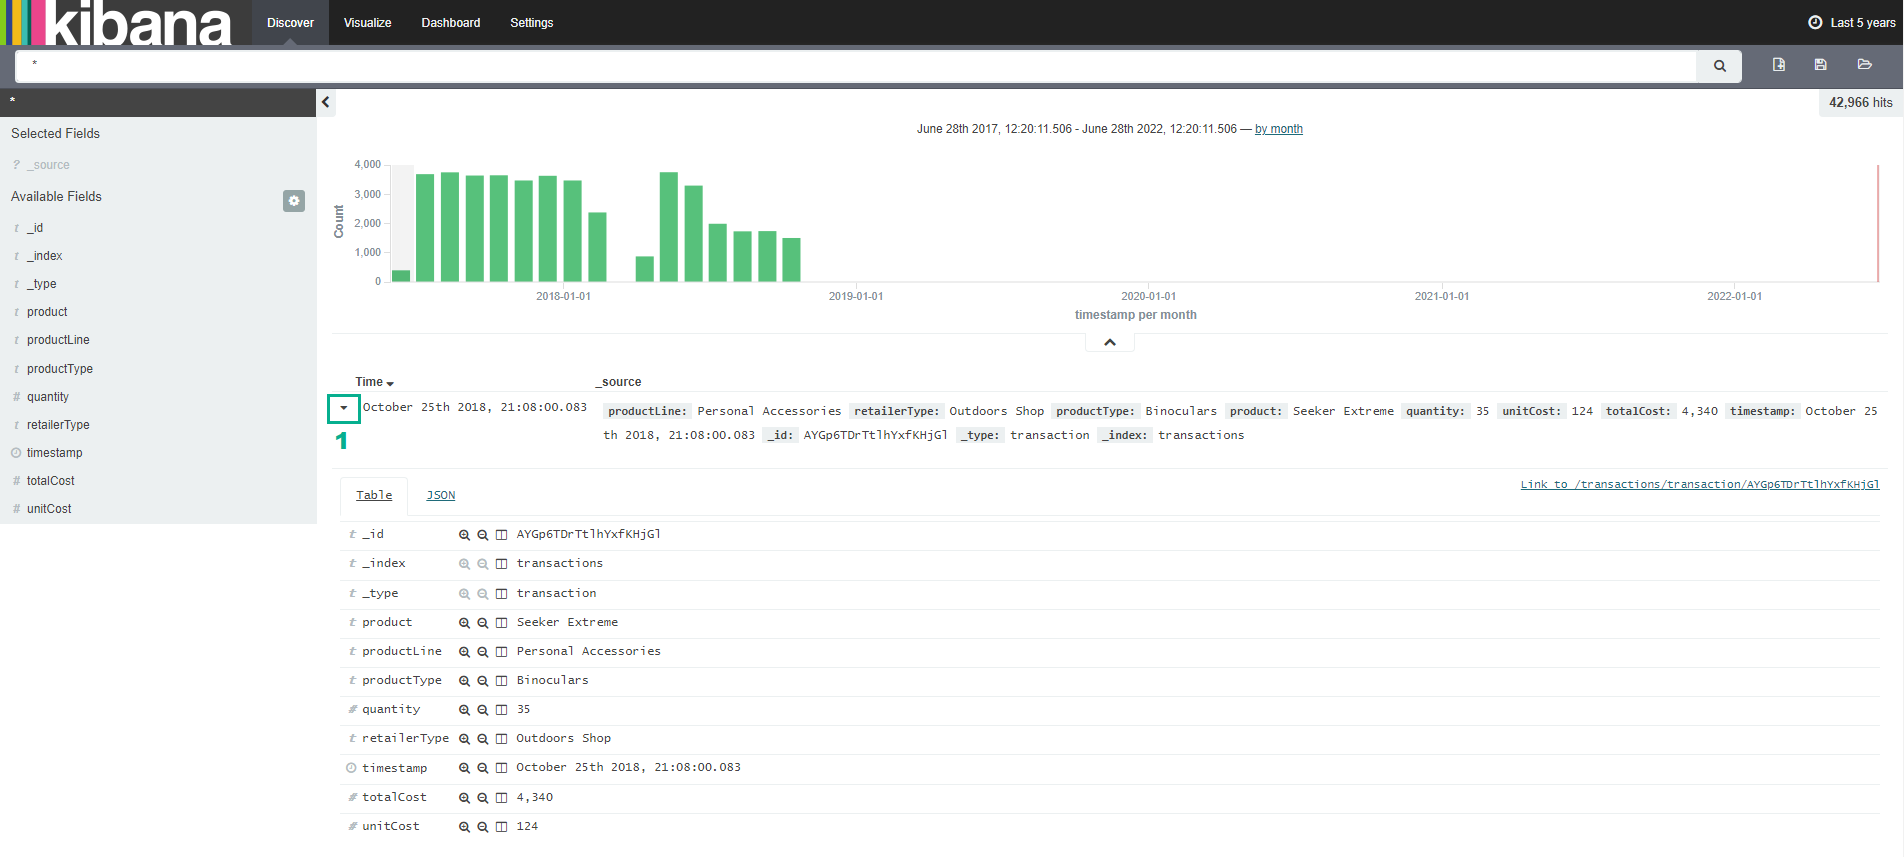
If you refer back to the Java code in the IDE, in both the Producer and Consumer applications, there is a class called SaleItemTransaction which has these same fields in it. This class is used to serialise and deserialise the sales data into and out of the Kinesis stream, and further, into the ElasticSearch index as you can see here.
Visualise the data in Kibana
In this section, we will visualise and analyse the sales data using Kibana.
- Click Visualize
- Click Pie chart
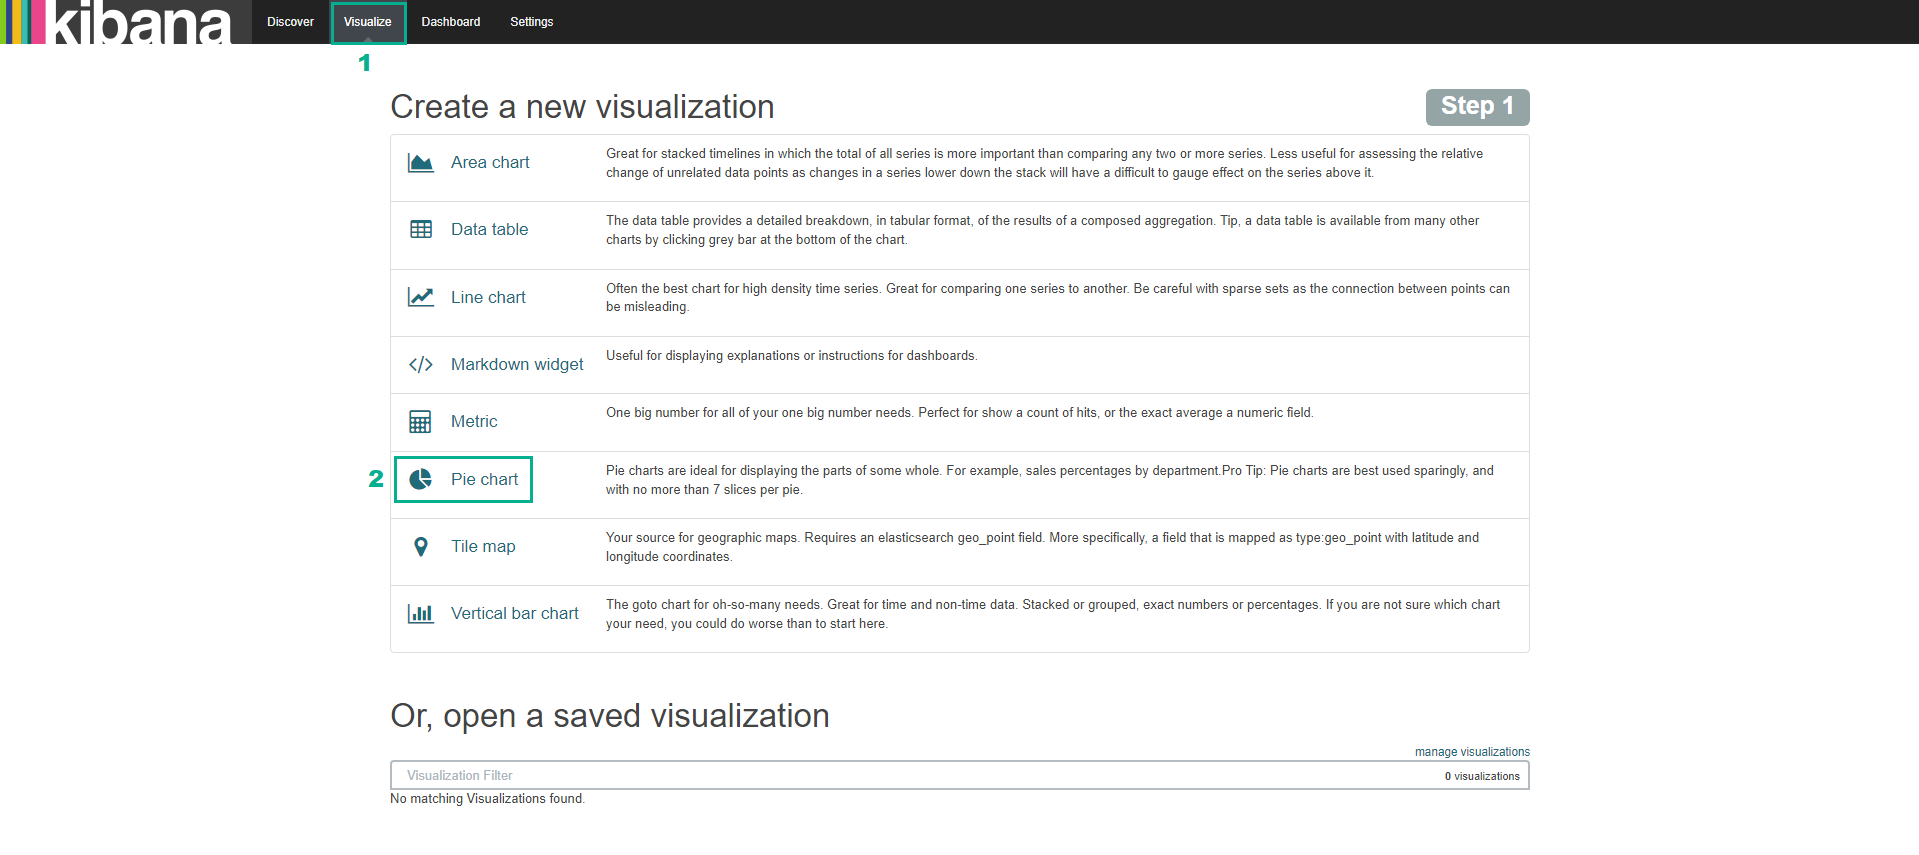
- Click From a new search
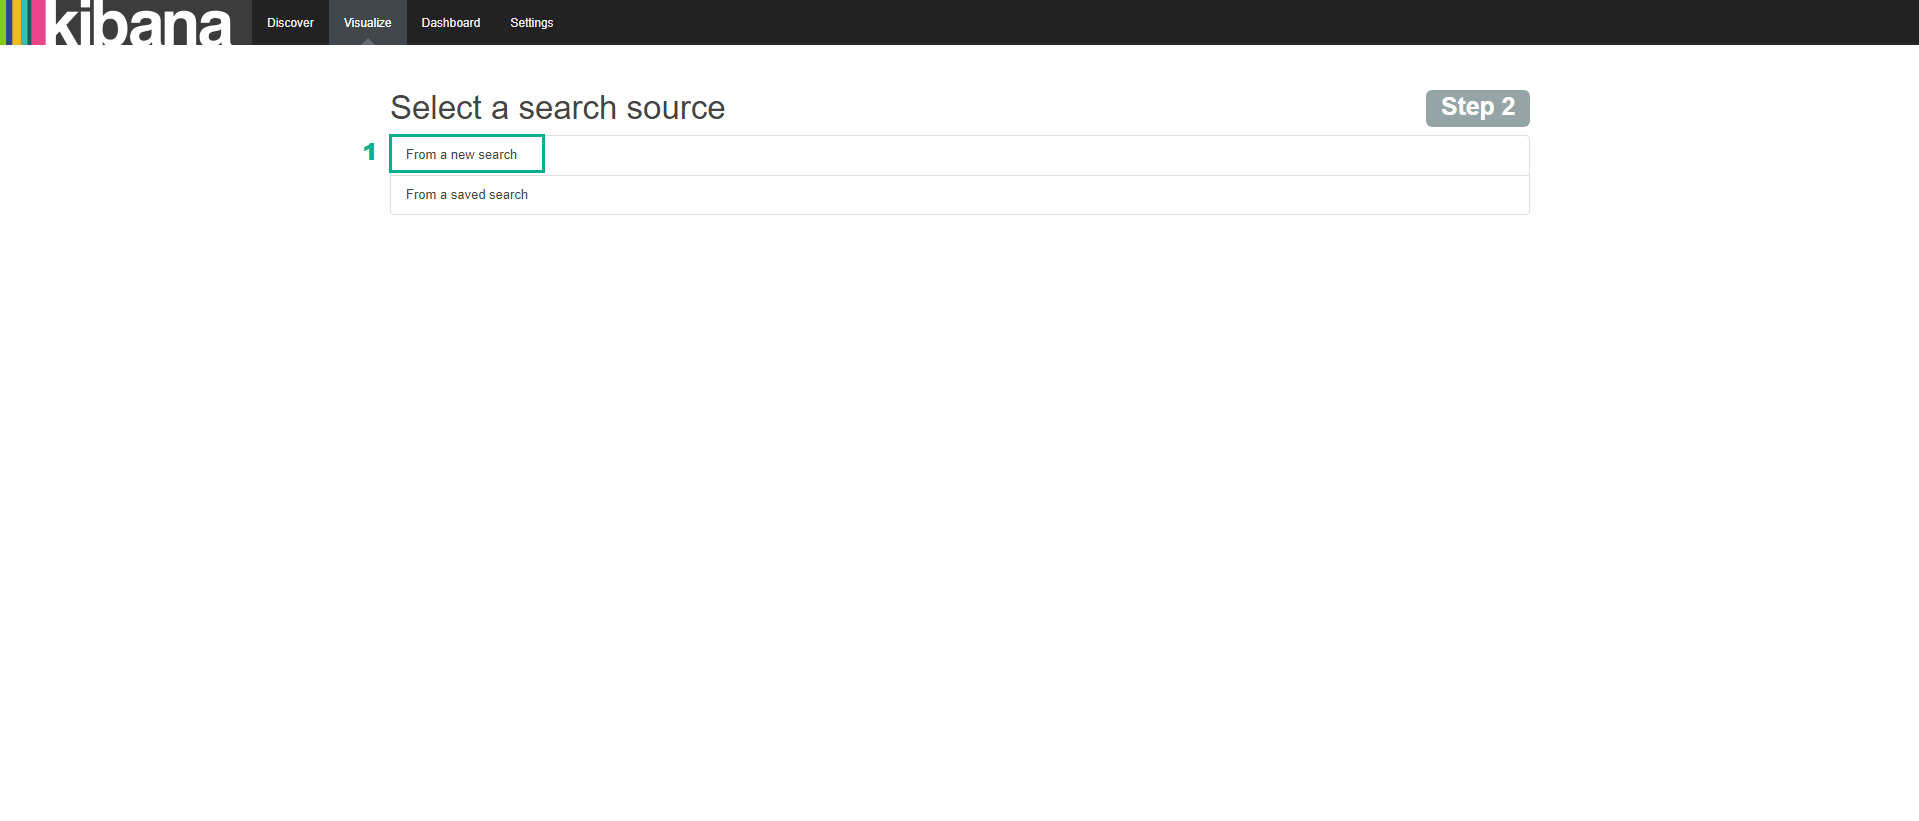
- Initially, you will see a pie chart that is a full circle made up of only one slice. We need to filter our data.
- Click Split Slices
- In the Aggregation section, select Terms
- In the Field section, select productType
- In the Size section, type
5 - Click Play icon
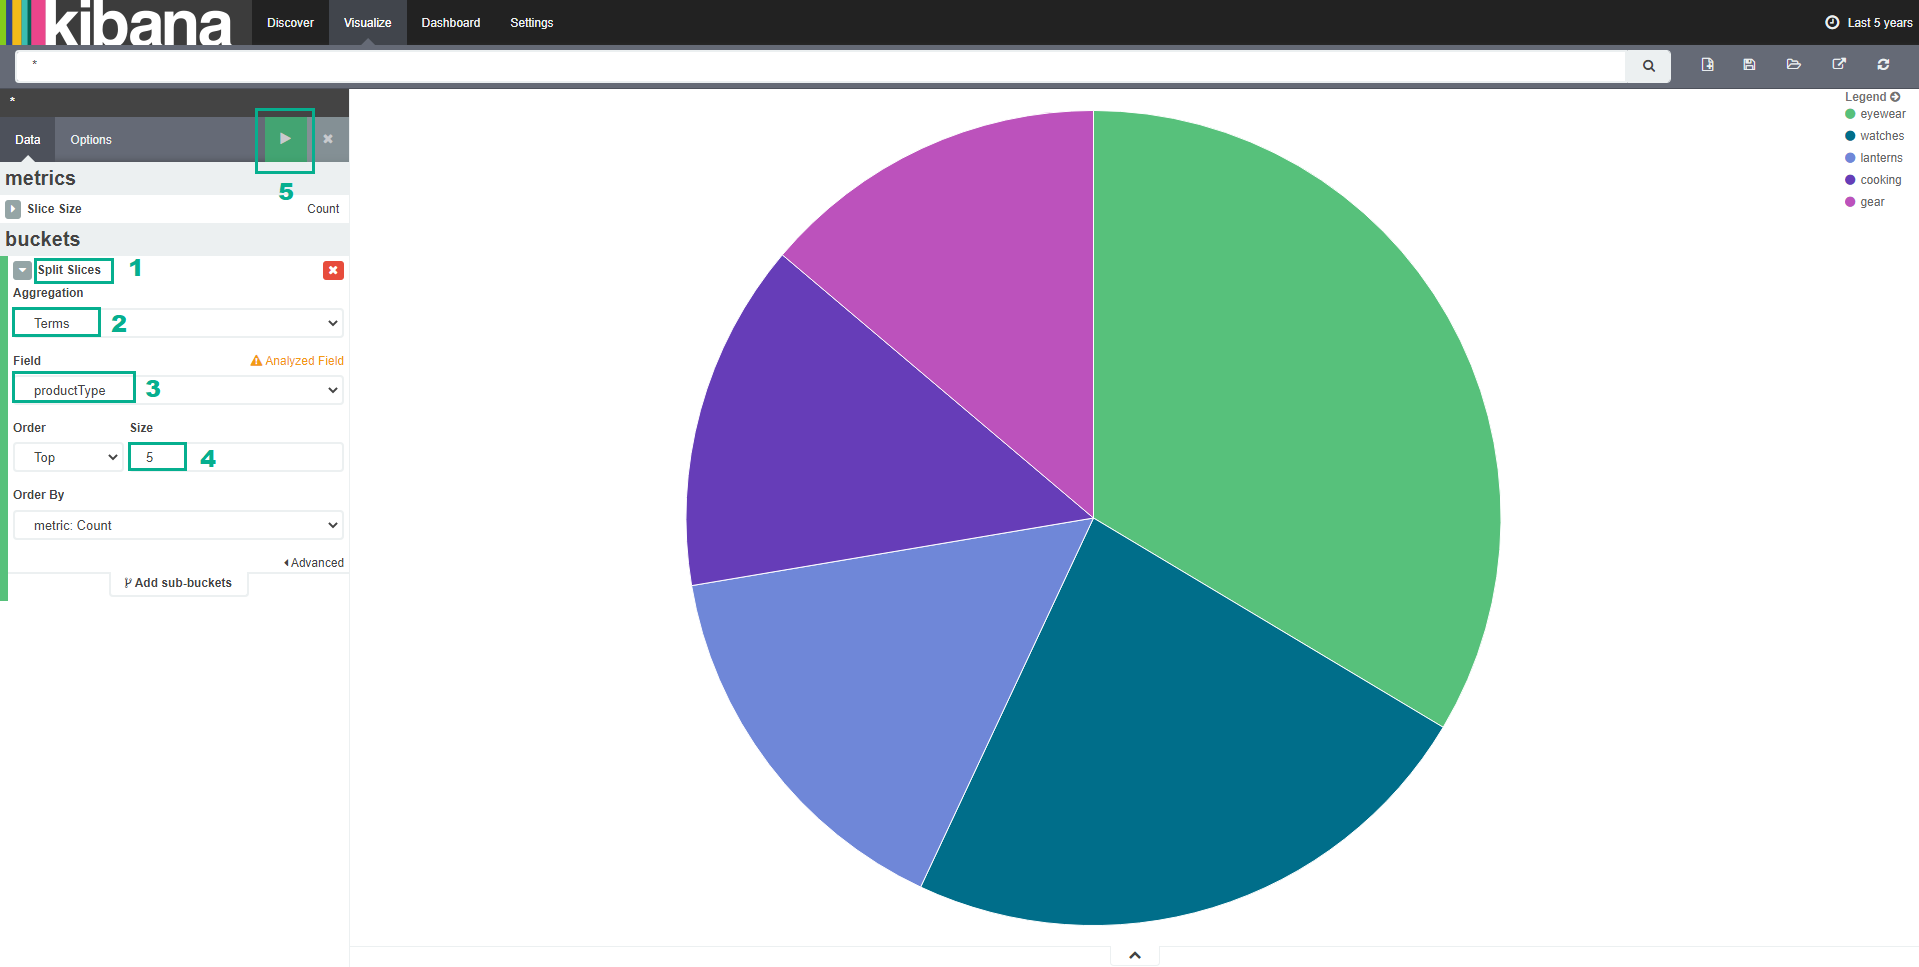 Your dataset will be different (due to the randomly-selected transactions and their details) but you will see a result similar to that shown here. In this example, Eyewear is the top moving product in the time period selected (Last 5 years).
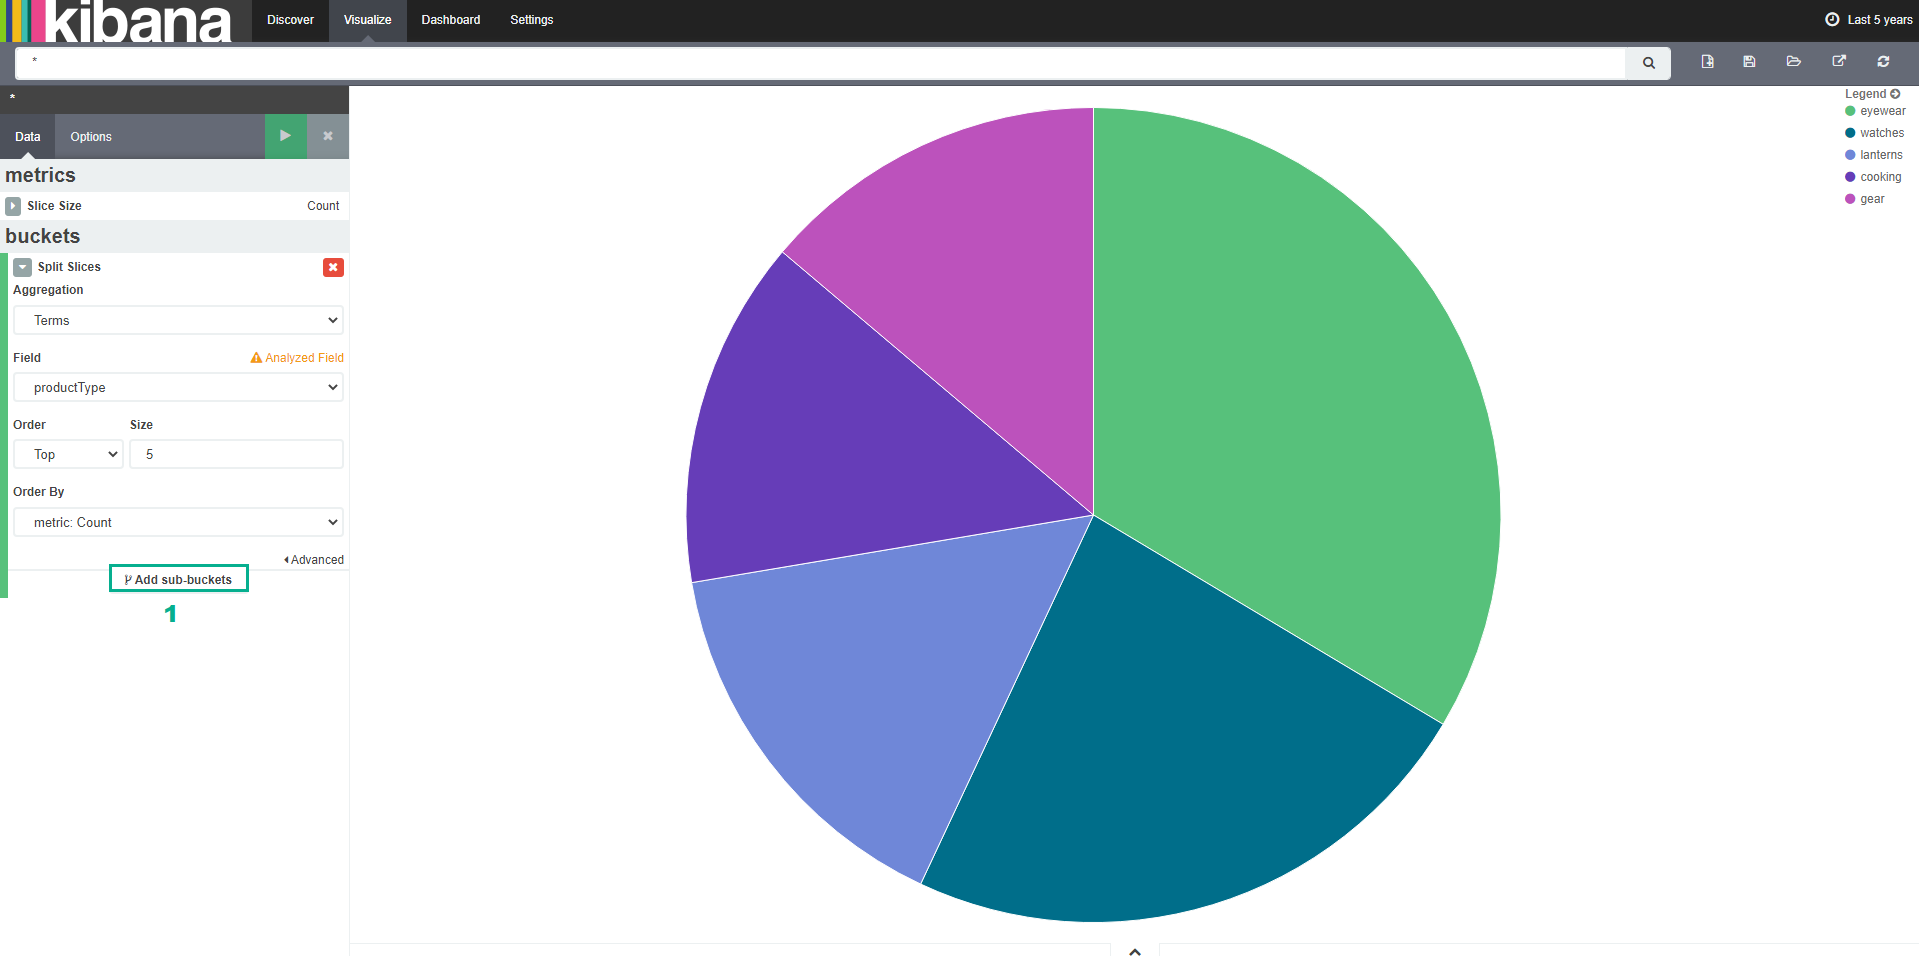
- Click Add sub-buckets
- Click Split Slices
- In the Sub aggregation section, select Terms
- In the Field section, select retailerType
- In the Size section, type
5 - Click Play icon
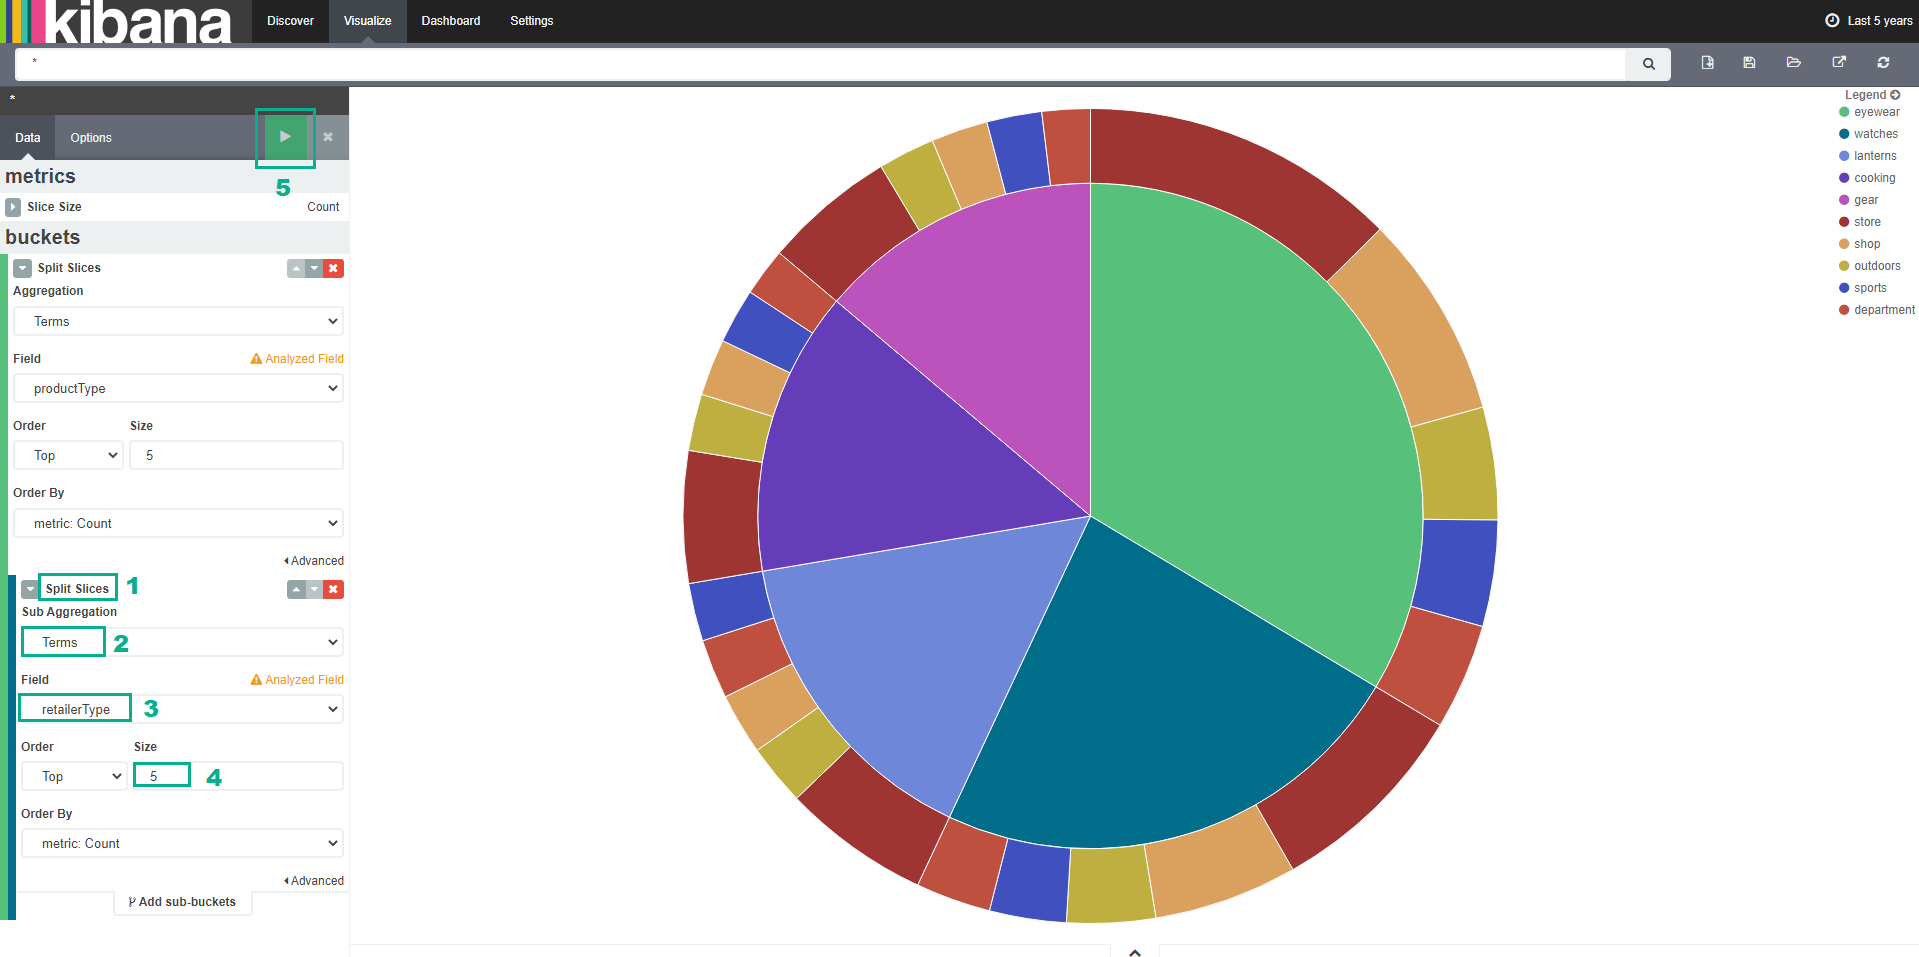
As you can see, Kibana is a very powerful tool for analysing your data. Take some time to experiment with other graph types, fields and aggregations. You can save each visualisation you create, and then add them to a dashboard using the tools and icons in the Kibana web page.
If you need to clear the records, mappings and index from the ElasticSearch domain, you can issue the following from a terminal window:
curl -XDELETE https://<ElasticsearchEndpoint>/transactions -k
But replace with the ElasticsearchEndpoint value from Cloudformation - Outputs tab.
You will then need to re-create the mappings, by running the mappings command you ran earlier. You can then re-populate your data set by running the Consumer and Producer applications again.